Log buffering with Lambda Powertools
Let's understand what log buffering is, how it's configured in your Lambda Functions and see real results in CloudWatch by trying different configuration options.

The Lambda Powertools team released a new feature that allows your Lambda functions to buffer logs. That sounded cool, but I didn’t understand how it would work or how logs would show in CloudWatch. I decided to try it out and provide a visual example of how it looks with different configuration options.
What is log buffering?
This is what the Lambda Powertools documentation says:
Log buffering enables you to buffer logs for a specific request or invocation. Enable log buffering by passing logBufferOptions when initializing a Logger instance. You can buffer logs at the WARNING, INFO, DEBUG, or TRACE level, and flush them automatically on error or manually as needed.
The three main terms from that explanation are buffering, level, and flush. Let’s explain each of these in the context of log buffering.
- Buffering—This means that the Lambda function will hold the logs in memory without sending them to CloudWatch unless necessary.
- Level - The log level at which you want to start buffering the logs. You can choose which level to begin buffering at. For example, if you configure the log buffer to do it at the INFO level, it will buffer those logs and any log levels with a lower value. In this case, it will also buffer TRACE and DEBUG. Below are all the supported log levels and their numeric value.
| Level |
Numeric Value |
|---|---|
| TRACE |
6 |
| DEBUG |
8 |
| INFO |
12 |
| WARN |
16 |
| ERROR |
20 |
| CRITICAL |
24 |
| SILENT |
28 |
- Flush - This means the buffered logs will get sent to CloudWatch. You can tell Lambda to send the logs to troubleshoot in case of errors in different ways.
Why buffer logs?
At this point, you might ask yourself, why do I want to buffer logs? The reason might not be immediately apparent. Logs are usually only needed when your application hits an error. This means that we are constantly logging things for all the successful requests and producing logs that no one will see. By enabling the logging buffer, you will only print the logs whenever a specific scenario or error is hit, allowing you to reduce the number of logs produced, the noise and, even better, your logging costs.
Configuration options
There are a few pieces of configuration for buffer logging that can be set when you initialize a logger to handle things according to your needs.
- enabled—this should be straightforward. Log buffering is turned off by default; in order to start using it, this parameter will need to be set to true.
- maxBytes—this is the max amount of bytes the buffer will hold in memory. If you hit the max limit, the buffer will start dropping older logs to accommodate the new ones. This configuration allows you to protect the Lambda function from running out of memory. The logger will be nice enough to let you know it did this whenever the logs are flushed. The default value for this is 20480 bytes.
- bufferAtVerbosity—this is where you will configure at which log level you want to start buffering. Whatever value you configure will be buffered, as will any level with a lower numeric value. The default log level set is DEBUG.
- flushOnErrorLog—This is a boolean value that tells the buffer to log whenever it encounters a logger.error call. When writing Lambda functions, we typically have a try/catch statement where we log any errors that get thrown. This helps automatically flush the logs when an error is caught and logged. The default value is true.
But now the question is, what happens if I don’t catch and log an error? Will I not be able to see the buffered logs? Thankfully, the Lambda Powertools team thought about this, and they allow you to flush the logs in two other ways:
- flushBufferOnUncaughtError—This option is only allowed when injecting the Lambda context into the logger. This property will flush the logs whenever the Lambda function encounters any error and is not explicitly handled by your code.
- flushBuffer function—You might want to flush the logs whenever a specific code path is hit or other scenarios that are specific for your use case. To do this, the logger has a new function called flushBuffer that will manually send all of the buffered logs into CloudWatch.
Let’s see this in action!
To enable this feature, all we have to do is set the enabled property to true in the logBufferOptions object for the Logger constructor, as shown below:
export const logger = new Logger({
  logBufferOptions: {
    enabled: true
 }
});
Now, to test, we will add all the different types of logs to our Lambda handler like this:
    logger.trace('Trace Log');
    logger.debug('Debug Log');
    logger.info('Info Log');
    logger.warn('Warn Log');
    logger.error('Error Log');
    logger.critical('Critical Log');
If we run the Lambda function and view the logs produced in CloudWatch, we get this:

The results were unexpected, but then I looked at the default values for the logger options to try and understand this better. There are two default values to keep in mind for this example: flushOnErrorLog is enabled by default, and the buffer’s default log level is DEBUG. With this, let’s understand why the logs show in this specific order:
- The TRACE and DEBUG logs are added to the buffer because of the log level setting and are not shown because of this.
- The INFO and WARN logs are printed as is since they are not included in the buffer because of the log level setting.
- The TRACE and DEBUG logs are now shown because we hit the ERROR log, which means the logs are flushed before the ERROR log is printed.
- Finally, the ERROR and CRITICAL logs are printed.
If we were to run the same test but, in this scenario, don’t log an error, we would really appreciate the value of the log buffer.

From the image above, we can see that only the non-buffered logs made it to CloudWatch, meaning that if there is no error, we won’t see or get charged for the buffered logs.
Now, let’s configure the logger to buffer at the WARN level.
export const logger = new Logger({
  logBufferOptions: {
    enabled: true,
    bufferAtVerbosity: 'WARN'
 }
});
As you can se, now we get fewer logs if we run our Lambda function because we are buffering at a higher level.

For our next test, let’s intentionally overload our buffer to make it hit the maximum size limit. For this example, we are going to manually flush the logs by calling the function. This means we’ll need to turn off the flushOnErrorLog property. In addition to that, we are going to set the maxBytes property to 1000, to make the test easier.
export const logger = new Logger({
  logBufferOptions: {
    enabled: true,
    bufferAtVerbosity: 'WARN',
    flushOnErrorLog: false,
    maxBytes: 1000
 }
});
And for the logging code, we’ll do a simple for loop and manually flush at the end.
for (let index = 0; index < 500; index++) {
  logger.trace('Trace Log');
  logger.debug('Debug Log');
  logger.info('Info Log');
  logger.warn('Warn Log');
  logger.error('Error Log');
}

logger.flushBuffer();
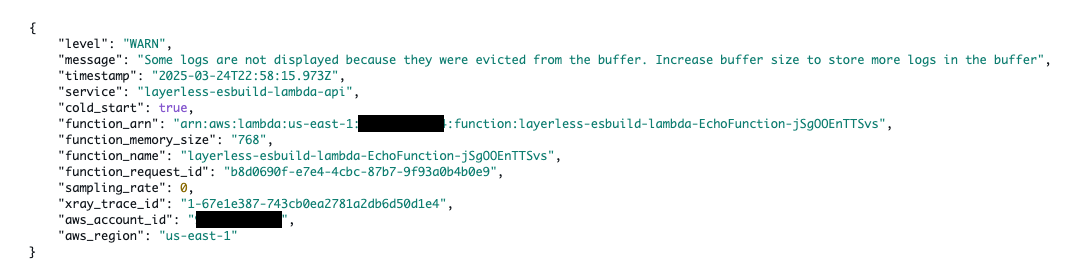
When we run this, Lambda Powertools will let us know that we’ve exceeded the buffer’s size and that some of the logs were lost to make room for the newer ones.
What happens if a single log exceeds the buffer’s size? Well, let’s try it. To do this, I will set the maxBytes property to 1 byte.
export const logger = new Logger({
  logBufferOptions: {
    enabled: true,
    bufferAtVerbosity: 'WARN',
    flushOnErrorLog: false,
    maxBytes: 1
 }
});
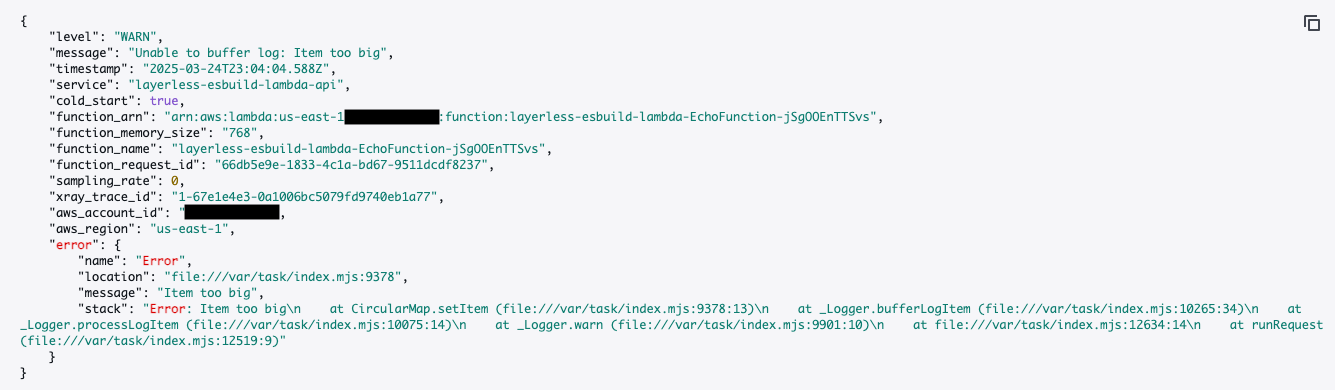
If we run the same code as above, we will see a message telling us the log could not be buffered because it was too big.
Wrap up
I’m very excited to start using this in projects and see how the CloudWatch pricing can be impacted. The best part is that Lambda Powertools is taking care of most of the heavy lifting, and all we have to do is configure a few properties to have it behave the way we want it to. I really want to thank the Lambda Powertools team, as they keep impressing me with all the great functionality they deliver that keep making my life easier.
Let me know what you think about this feature!
Until next time!
Andres Moreno